Open data is used broadly both in the public sector and in the projects of individual application developers. Organisations have become more efficient with the use of open data and it has also made many people’s daily lives easier. Thanks to these applications, you don’t have to wait for public transport to arrive, you can just check where they are on a map. The possibilities to use open data are almost limitless and just to see how versatilely it can be used, we have collected different examples to our showcase gallery.
To celebrate the last working week of our content creators, we are going to tell you about opendata.fi team’s favourite, must-have apps! We recommend trying them out.
Easily our favourite app in the transport category is junat.net (trains.net). It is a simple, easy-to-use website that shows real-time train timetables. The best thing about this showcase is that it shows the delays quicker than the VR timetable displays! So, if you want to be ahead of all the other train passengers, we recommend bookmarking junat.net. Another great transport related website is the Traffic Situation service. It is useful when you want to see how bad of a rush hour there is on Midsummer when everyone is going to their summer cottages. If you want to make navigating easier, whether you’re using a city bike or a bus or anything in between, take a look at the Transport-category in our showcase gallery.

Open data makes forecasting weather easier as well!
One of our favourites is Sataako.fi (IsItRaining.fi). You can use it to see if it’s raining outside right now or not. No need to stare out the window trying to figure out whether it’s really raining or not anymore. Another showcase worth mentioning would be Tuulikartta.info (Windmap.info) that visualises cool weather features on a map, such as wind speeds, cloudiness, lightning observations and much else.
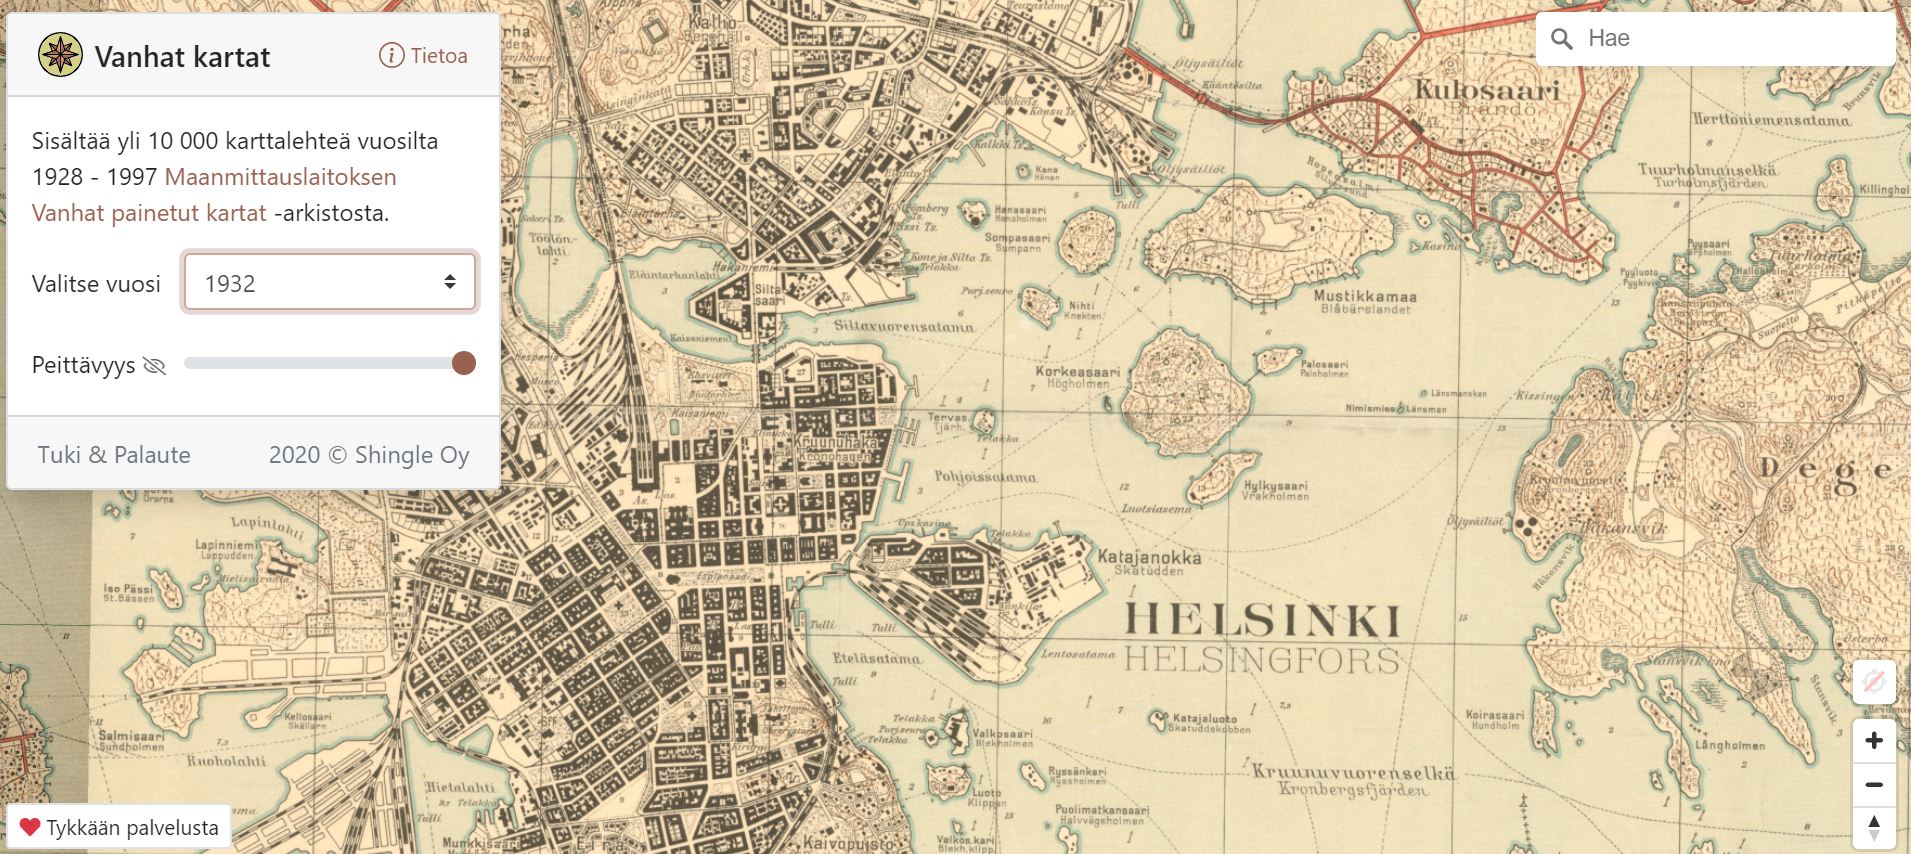
Different kinds of maps are often used to help visualise data. If you want to see just how much maps have developed over the years, we recommend checking out Vanhatkartat.fi (Oldmaps.fi). It shows old maps in a digital format and you can compare them to the current map to see how much your neighbourhood has changed over time. The oldest maps are from the year 1928! The website is in Finnish, but it is fairly easy to use even if you don’t know the language.
One of the most important effects of open data is that it makes society more transparent
Tutkihankintoja.fi (OpenProcurement.fi) allows you to explore public spending so you can see where your tax money is going. Open data can also make following politics more enjoyable. With the VoteOn-app you can easily follow decision-making processes in Parliaments as well as in your municipal council. We recommend checking this out before the next elections.
One of the most interesting services that has been created by using and linking open data is Warsampo. With WarSampo you can see the Winter War and the Continuation War events visualised on a map. In addition, you can search for specific army units or certain people to see where they have fought. Unfortunately, not all the information is available in English.

There would be many more showcases to mention but you can go and check them out from our showcase gallery. Even though our content creation team is moving to other projects, you can still tell us about new showcases you have created. The service administrators will add them to our service as soon as possible.
We want to say a big thank you to everyone who has already added their showcase to our gallery. The things you can do with open data!