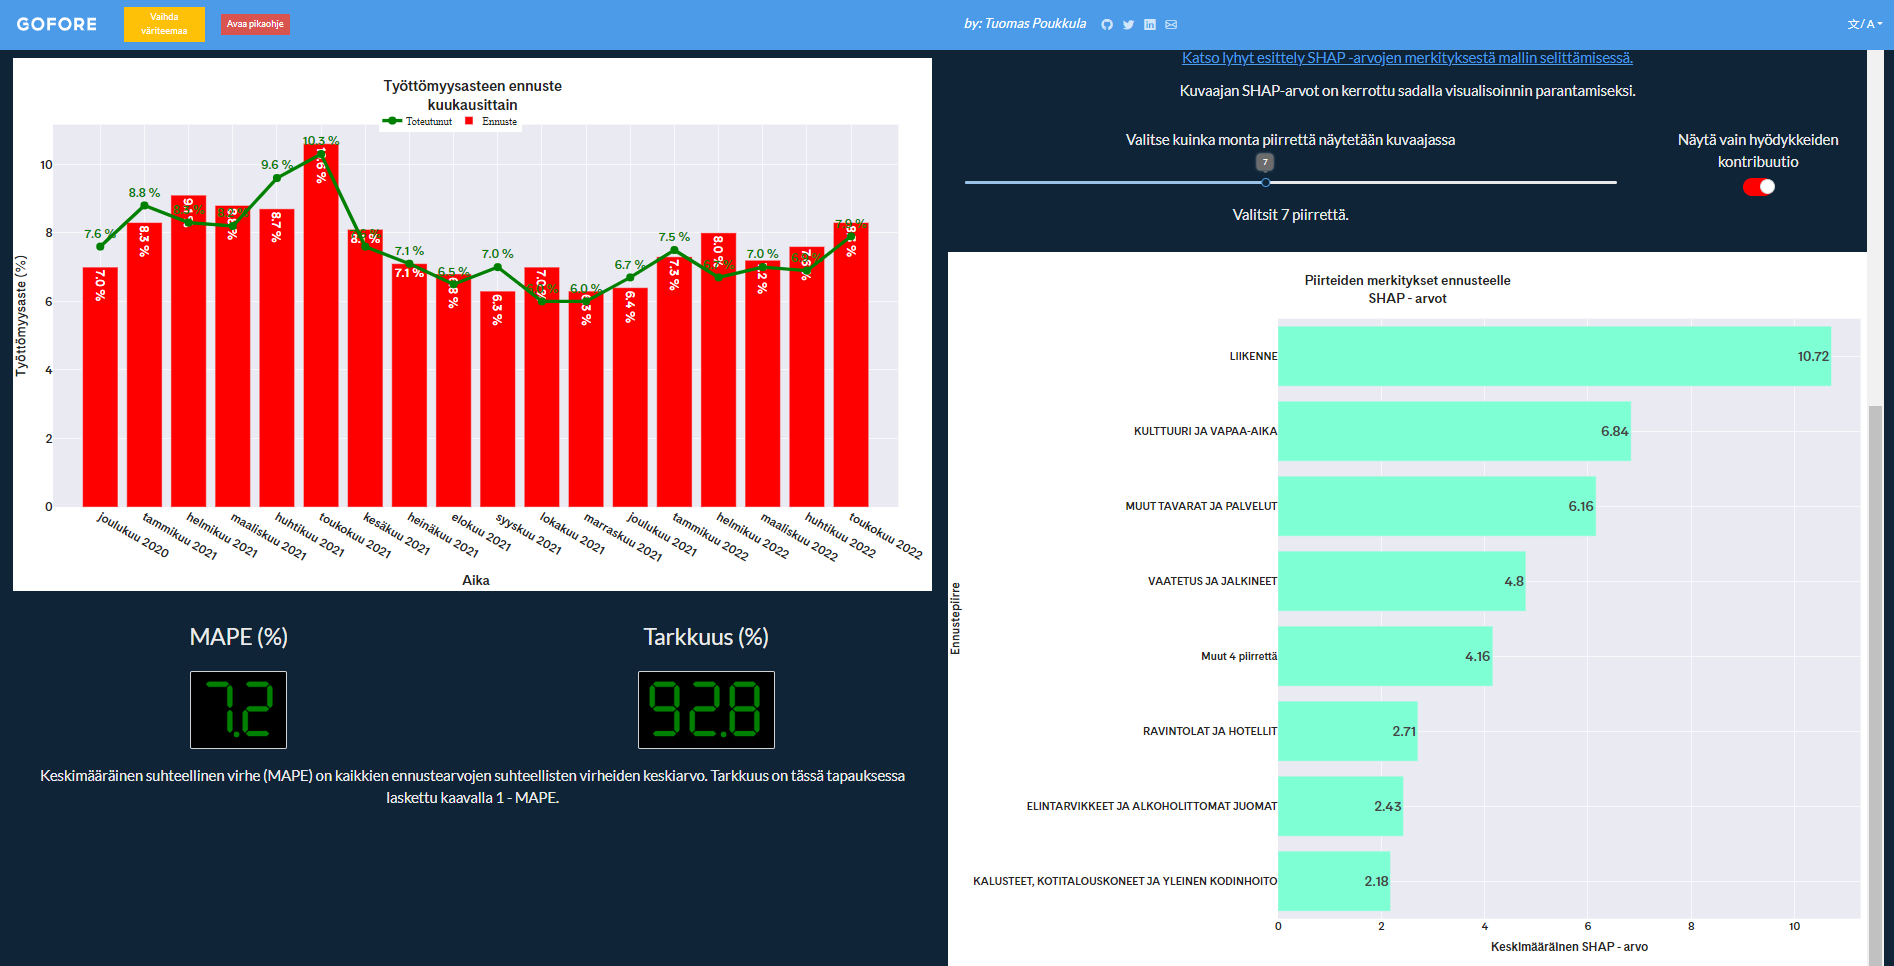
As consumer prices rise, it is also worth examining how inflation affects other macroeconomic phenomena, such as unemployment. There is a theory called the Phillips curve which states that in the short term there is a contradiction between inflation and unemployment. So, in theory, there is a relationship between unemployment and inflation. With this application you can develop a machine learning method that aims to predict unemployment based on the components of inflation, i.e. consumer price indices. The freedom to develop a solution lies with the user. With this application you can try different commodity baskets and scientific methods for predicting unemployment, easily with the help of a graphical user interface. The application contains links to additional documentation and educational videos that aim to educate the user and teach terminology related to machine learning and data science.
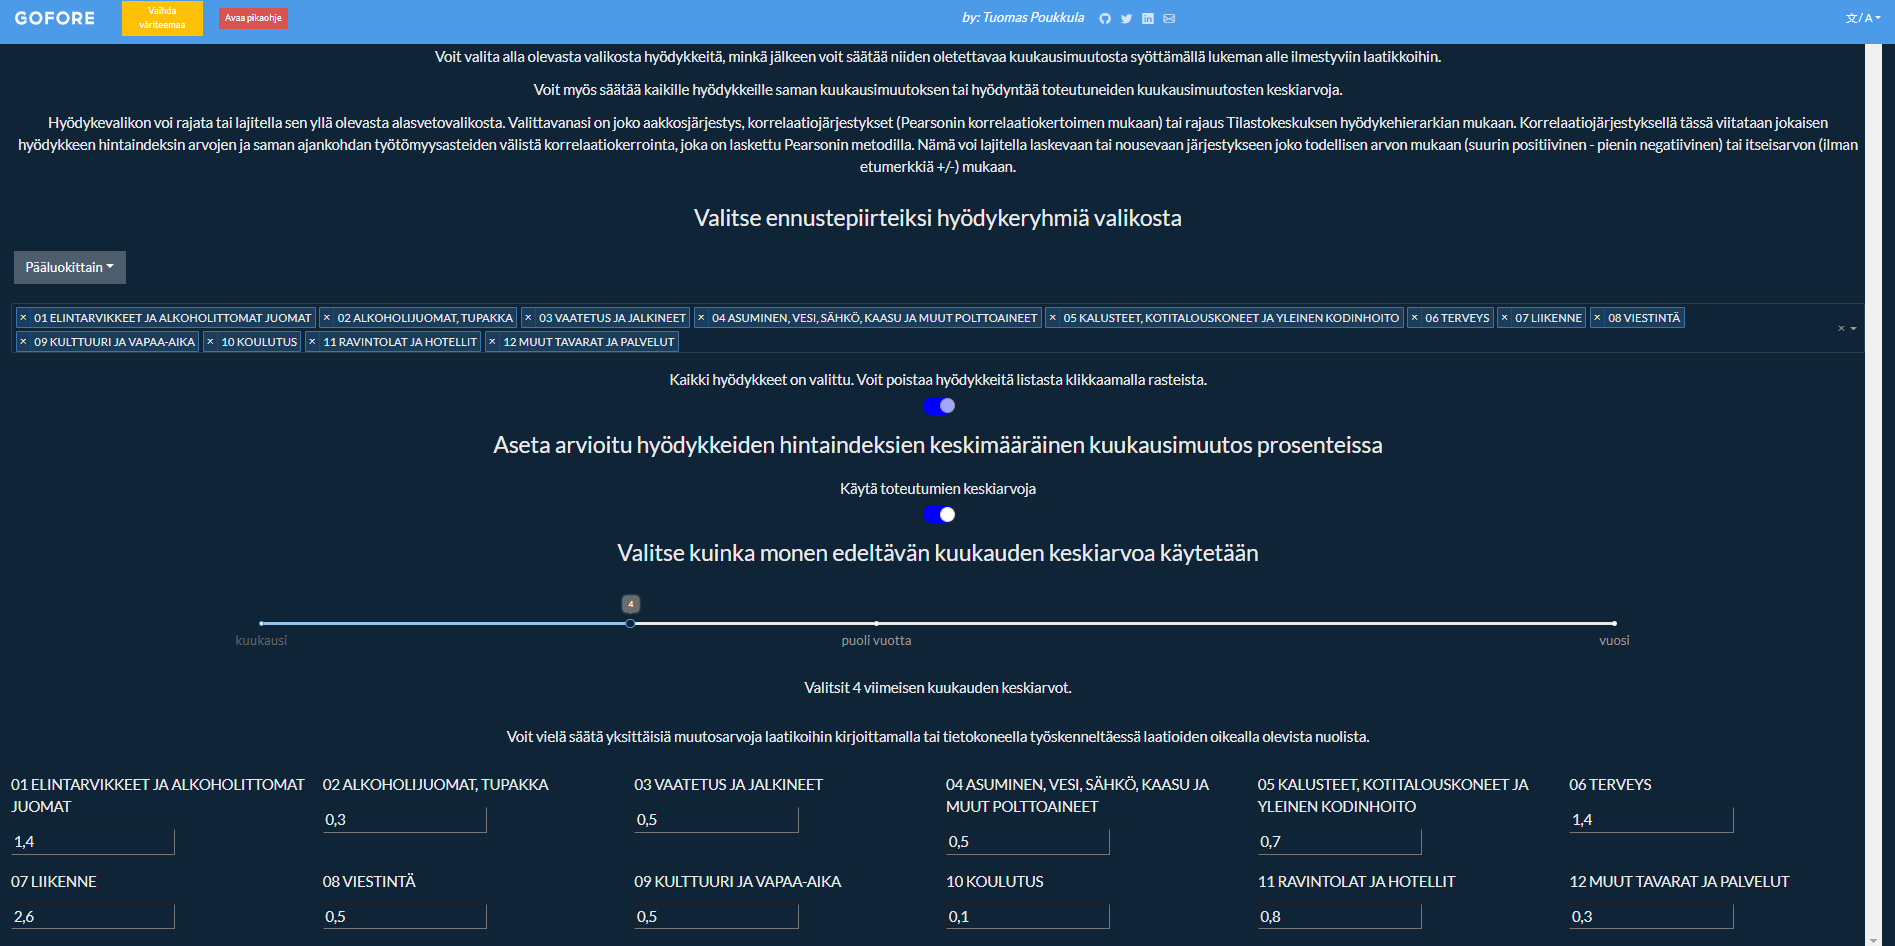
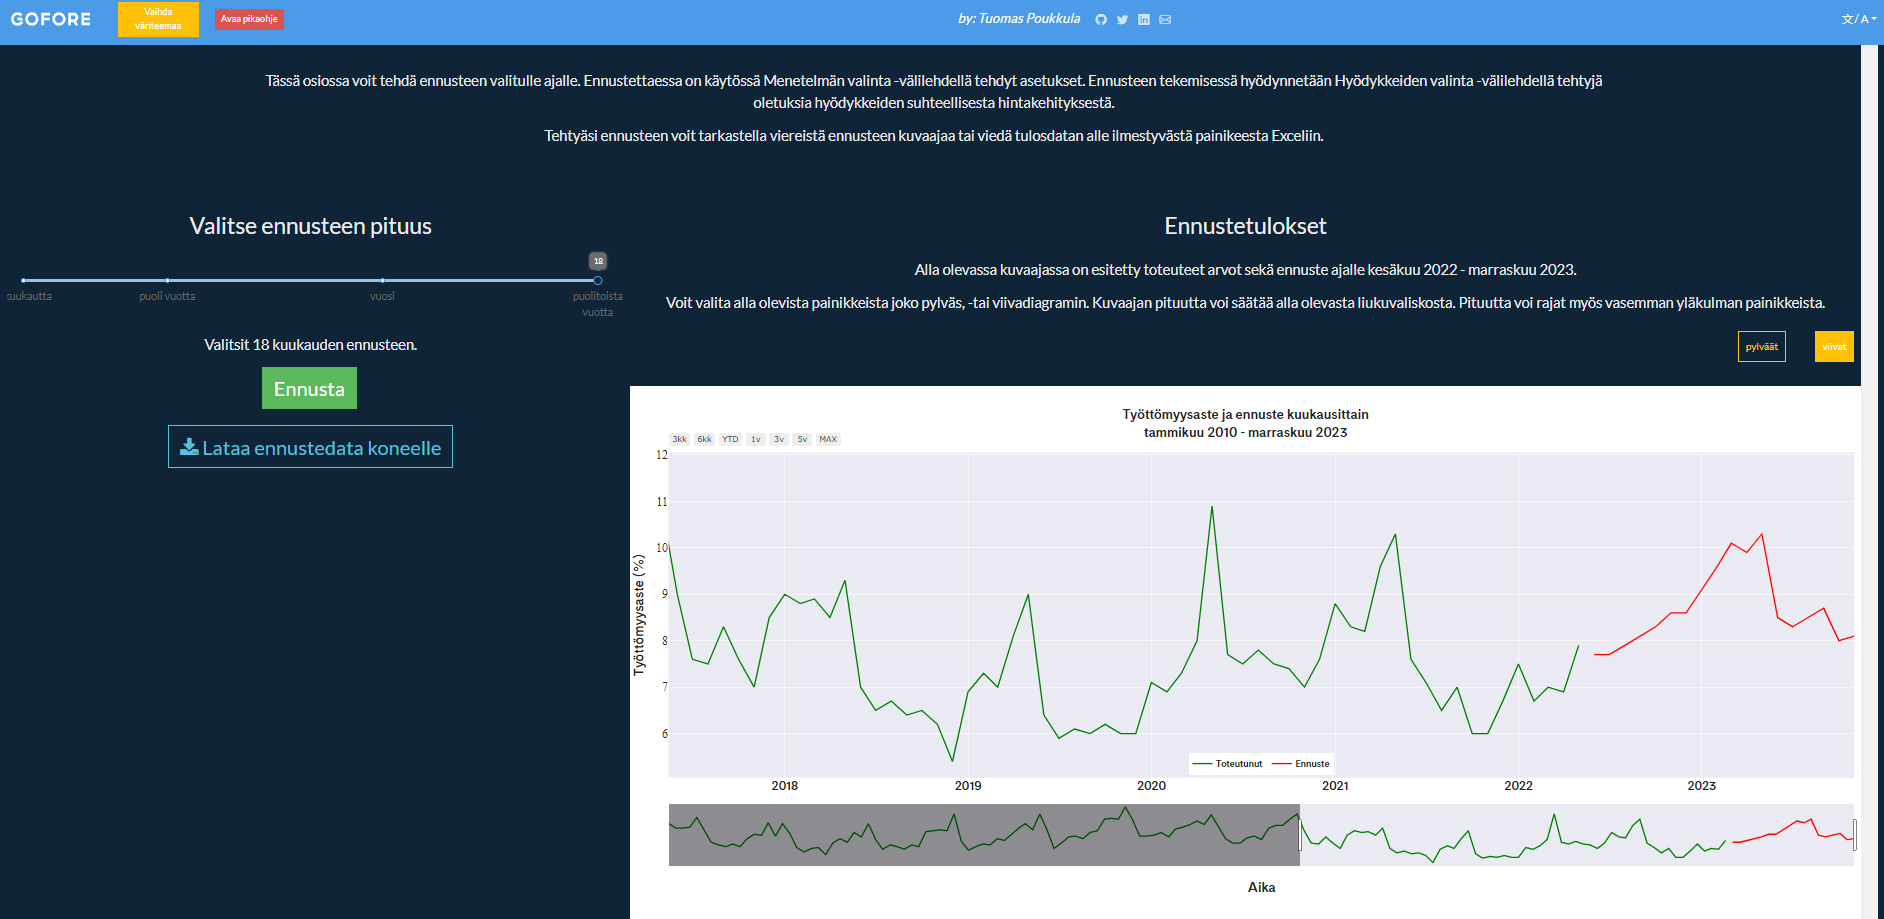
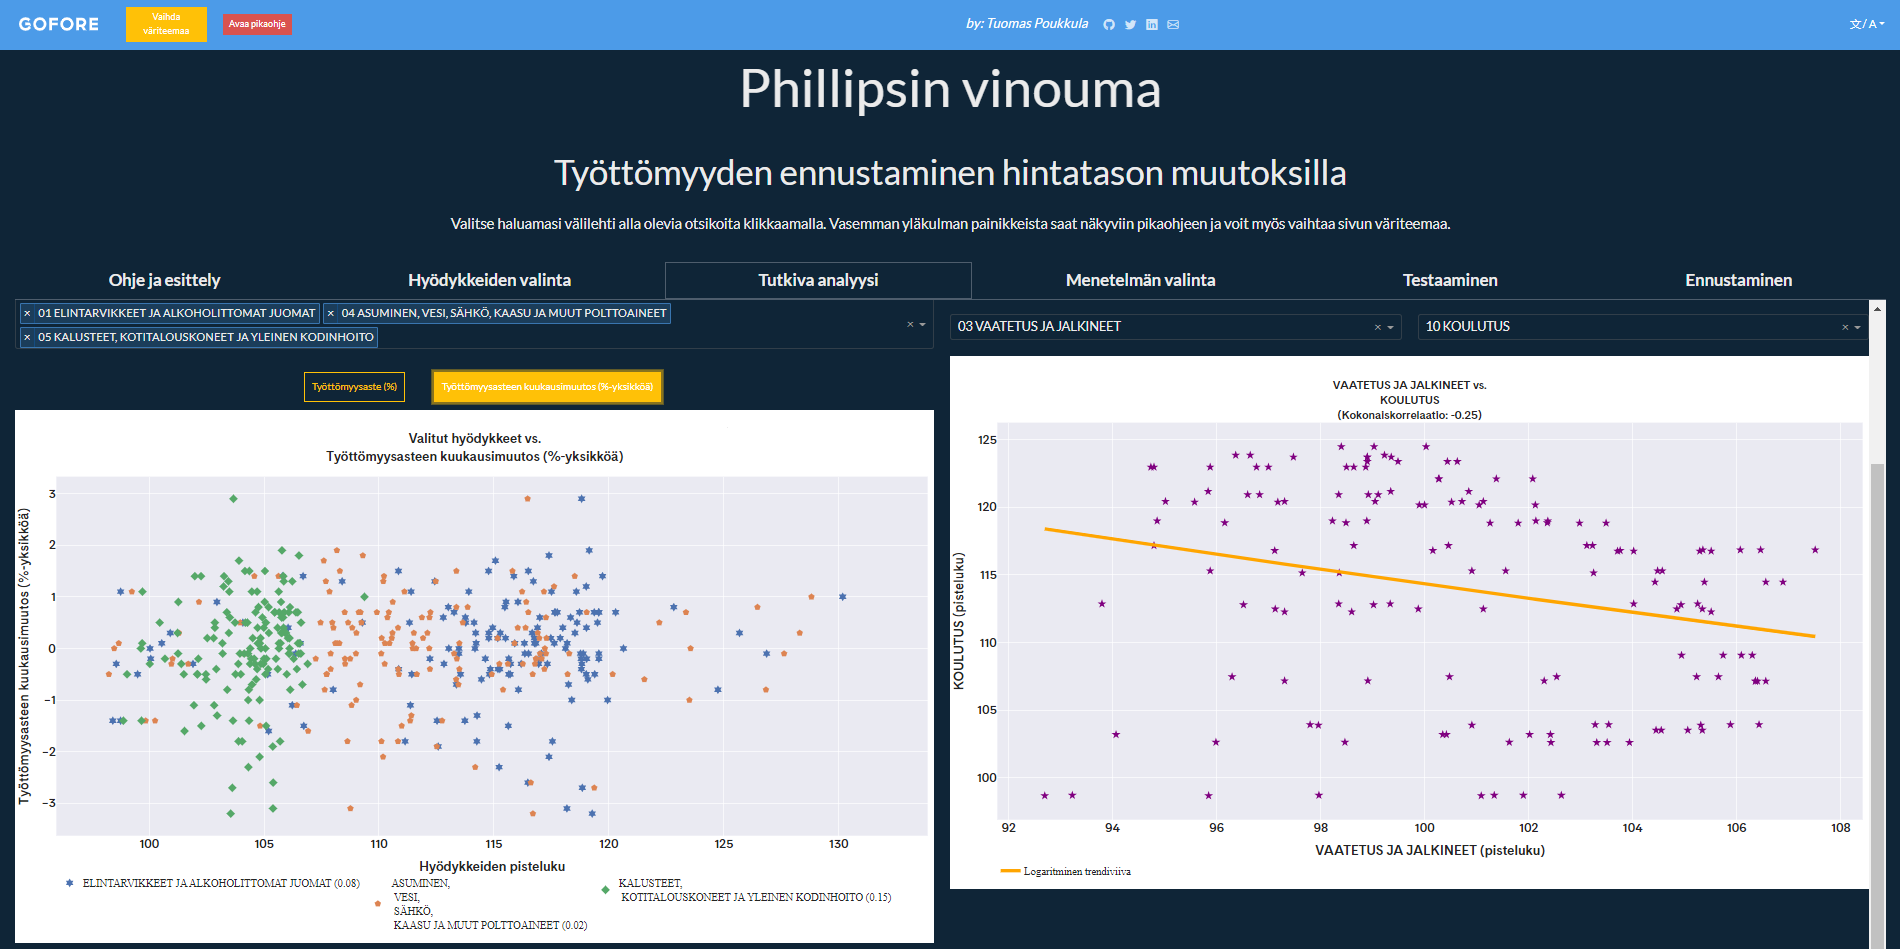
In this application, the user chooses the consumer products themselves, whose price changes are utilized in predicting unemployment. You can choose the machine learning algorithm yourself and adjust its hyperparameters to your liking. The application allows you to test your model and examine which consumer products influenced the forecast the most. Predictions can be made using the assumptions that the user enters into the tool. All data and work documentation can be exported to Excel files. For product selection and evaluation of change assumptions, the application also includes a section of exploratory analysis, where you can examine the relationship between commodities and their relationship to unemployment rate and monthly changes in unemployment rate.
The application works on most browsers and also works as a progressive web application, so it can be downloaded to a computer or mobile device. The application is implemented in Finnish, Swedish and English. You can change the color scheme of the application as you wish.